The pin bar is one of the most reliable and well-known candlestick patterns, and when traders see it on the chart, the price is likely to change direction immediately.
What are pin bars?
A pin bar is a type of candlestick that signals a price reversal. It consists of a long shadow, a small shadow, and a body in between. Interesting fact: the name of this pattern is short for Pinocchio (pin), because it has a long axis similar to Pinocchio's nose.
bearish pin bar forms after a solid move up or at the end of an uptrend. The body is smaller than the body of the previous bullish candle. This pattern has a long upper tail, which can be three or more times its body size. This pattern can be a bearish or bullish candle, but bearish is believed to give a stronger signal. This pattern should be confirmed by a bearish candle that opened below the body of the bearish pin bar. This signal indicates that buyers tried to push the price up, but their attempts failed.
bullish pin bar appears at the end of a down move or downtrend. This pattern opens within the body of the previous bearish candle and has a long lower tail and small body. This pattern should be confirmed by a bullish candlestick that opened above the closing price of a bullish pin bar.
Strategy setting
Sell position entry rules
Mark key levels and identify trend lines. When the pin bar forms at an important resistance level, place a “Sell” order 10-20 points below the pin bar's lower level. Place a Stop Loss 20-30 points above the resistance line that has rejected the price. Place Take Profit with a 1:2 or 1:3 risk-profit ratio, or close the order at a significant support level.
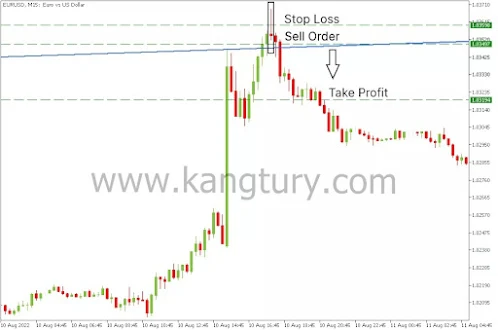
The chart above shows that EURUSD is trying to climb higher after hitting the local trend line within the M15 timeframe. However, buyers were unable to hold positions for a long time. Therefore, a pin bar is formed. After confirming, we placed a sell order below the pin bar's bottom level at 1.03497 and Stop Loss above the latest resistance line at 1.03598. Place the Take Profit level at 1.03194. The result, recorded a profit of 302 points.
Buy position entry rules
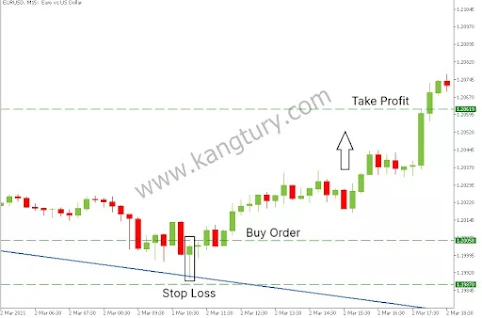
Mark key levels and identify trend lines. When the pin bar forms at an important support level, place a “Buy” order 10-20 points above the top level of the pin bar. Place a Stop Loss 20-30 points below the support line that has rejected the price. Place Take Profit with a risk-profit ratio of 1:2 or 1:3, or close the order at a significant resistance level.


.png)
0 Comments