What is Momentum and How to Define It
Momentum is a fundamental concept in physics that describes the motion of objects. It is also a term used in everyday life to describe the force behind a particular action or movement. In this guide, we will explore the definition of momentum, its various forms, and how it applies to both physics and everyday situations.Understanding the basics of momentum.
Momentum is a measure of an object's motion and is defined as the product of its mass and velocity. In simpler terms, it is the force that keeps an object moving in a particular direction. The greater the mass and velocity of an object, the greater its momentum. Momentum can be transferred from one object to another through collisions or other interactions, and it is conserved in a closed system. Understanding the basics of momentum is essential in physics and can also be applied to everyday situations, such as sports and transportation. In technical analysis, there is the term "Momentum", which refers to the force behind a trend. Momentum is measured by a series of technical indicators (RSI, Stochastic Oscillator, MACD).Each indicator uses a slightly different approach and has its own formula.Here we will present another indicator from this group. His name is simply "Momentum". The Momentum technical indicator measures the amount that the price of an asset has changed over a given period of time. The indicator formula compares the most recent closing price with a previous closing price.
How to implement.
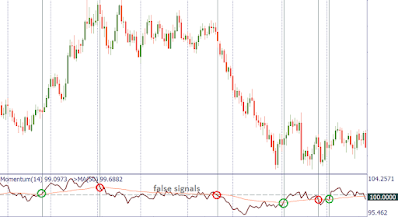
To add Momentum to a chart, click on "Insert" – "Indicators" – "Oscillators" ("Insert" – "Indicators" – "Oscillators") – and you will see the "Momentum".The default parameter for Momentum in MT4 is 14, but you can set it to whatever value you like. The indicator can be used successfully in any temporality. Note that the smaller the temporality used, the more responsive the performance will be. At the same time, the indicator is likely to generate more false signals compared to its operation on a longer timeframe.
How to interpret.
Momentum oscillates around a central value of 100. This level is not automatically marked in MetaTrader, but you can plot it. When the indicator value exceeds 100, it indicates that buyers are in charge. Conversely, a move below 100 is a sign of bear dominance. If Momentum reaches extremely high or low values (relative to its historical values), the current up/down trend is likely to continue. The extreme levels of the indicator mean that there is enough momentum (impulse) behind a trend to support the price.At the same time, the Momentum indicator can also help identify when a market is overbought or oversold. When a falling market is oversold, it may be about to bounce. If the momentum bottoms out and appears, it is a buy signal. When a rising market is overbought, it may be about to fall. If the momentum peaks and pulls back lower, it is a sell signal. You can apply a short-term Moving Average to the indicator to make it easier to determine its turning points. To do this, select "Moving Average" among the MT4 Trend Indicators in the "Navigator" panel, and then drag and drop it onto the Momentum indicator chart. In the pop-up window, select "First Indicator's Data" from the "Apply to" dropdown menu on the "Parameters" tab.
The strategy then will be to buy when Momentum crosses the Moving Average to the upside, and sell when it crosses the Simple Moving Average to the downside. In this way the "timing" of the signals will improve a little.
It is advisable to choose the signals that are in line with the trend that you observe in a longer timeframe or using other trend indicators.
Enter the market only after the prices confirm the signal generated by the indicator. If the momentum has reached the top, wait for the price to start to fall and then sell.
Often, momentum starts to come back before price. When momentum differs from price, it could be thought of as a leading indicator that points to a potential top (when momentum is falling while prices are rising) or bottom (when momentum is rising while prices are falling).


.png)
0 Comments